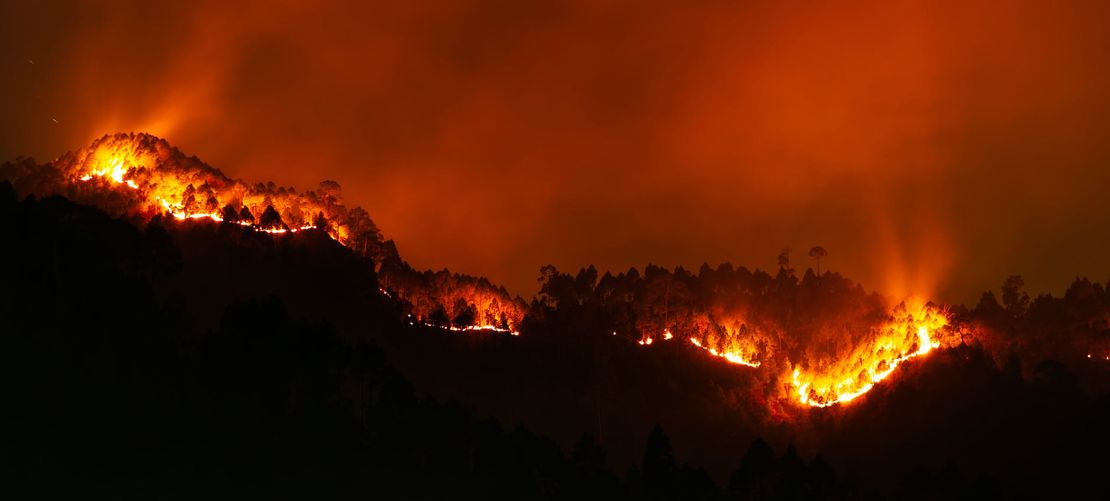
How-to use Satellite Imagery
- Disaster Science
- Bushfire.io pro
- September 2, 2025
Table of Contents
When you open Bushfire.io, the map you see — with towns, roads, and landscapes — comes from base imagery similar to Google Maps. That’s a static snapshot, refreshed every year or two in populated areas, but less often in remote regions. (For more on why the static satellite base map can look out of date and how Pro’s ESRI imagery helps, see Why is my satellite imagery out of date?.)
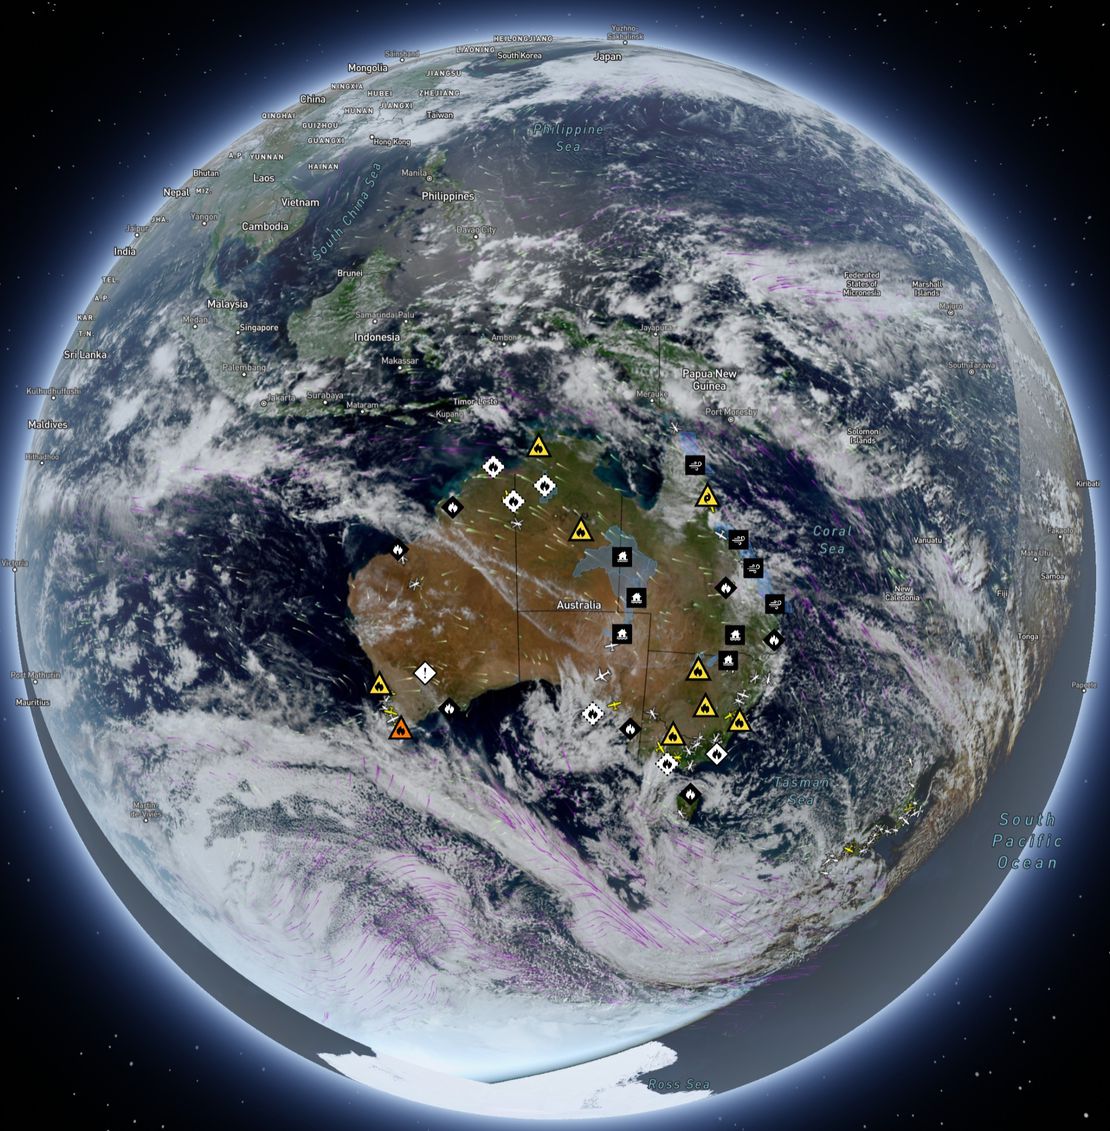
Geostationary satellite imagery is different: it’s live, dynamic, and updated about every 10 minutes. These satellites hover over fixed longitudes, continuously imaging the same region. Bushfire.io stitches their feeds into a global mosaic, showing near real-time conditions — clouds, storms, smoke, and fire — all on one map.
The catch is resolution: about 500 m per pixel. Perfect for tracking large-scale events, but not detailed enough for street-level views.
Satellites also go beyond what our eyes can see. True Colour imagery shows Earth naturally, while False Colour highlights features like storms, heat, dust, or cloud types using invisible wavelengths.
Enabling Near Real-Time Imagery
Info
Requires a subscription to Bushfire.io Pro, Business or Enterprise.
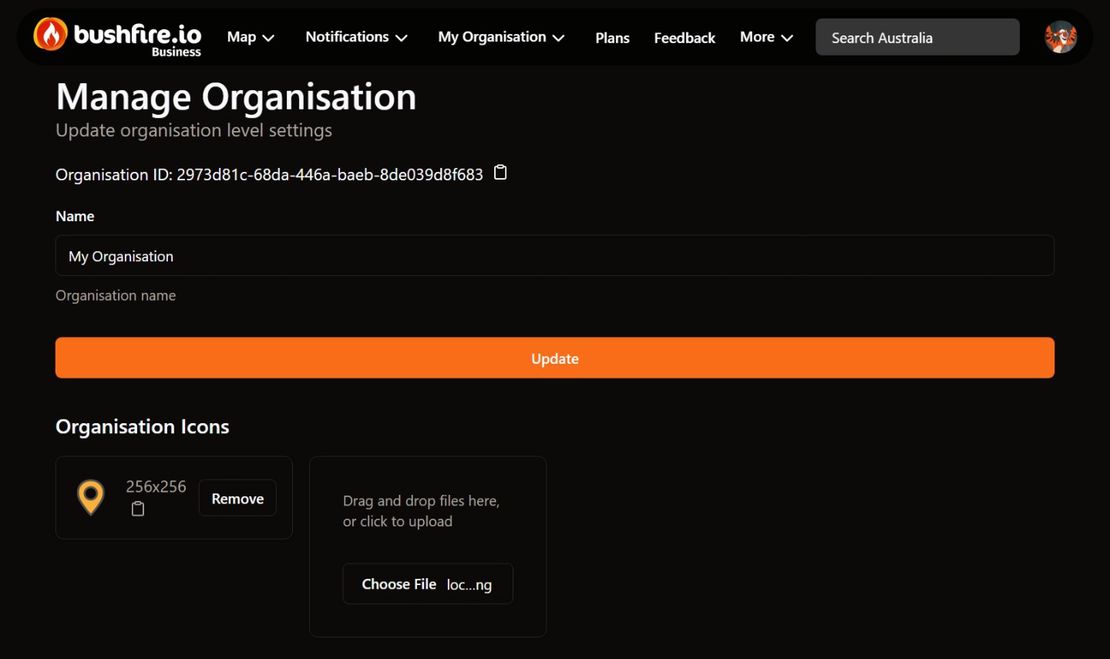
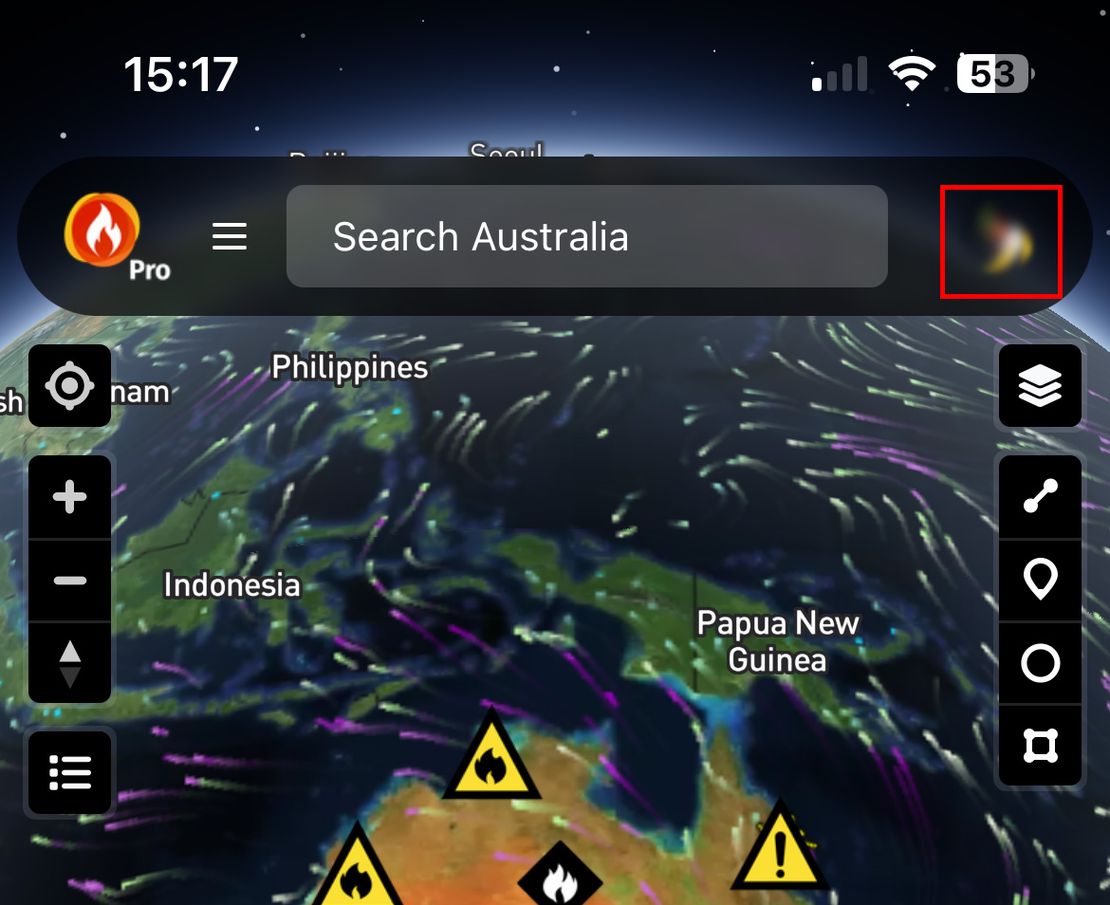
- To enable real-time imagery in Bushfire.io Pro, you need to open the right-side menu and choose which layer to enable.

- Select which layer to enable.

- Near real-time satellite imagery will only be shown at higher zoom levels (when you’re zoomed out beyond town level (zoom levels 0-7 or 8).
Layers Available in Bushfire.io
Satellite data is captured in many different “channels” of light, some visible to the human eye and others not. By processing and colouring these channels in specific ways, we can create layers that highlight different features — like smoke, storm intensity, or nighttime clouds. Bushfire.io Pro gives you access to these layers, so you can switch between them depending on the conditions you’re tracking.
True Colour
- Replicates natural colours of the Earth and is useful for visualising weather systems, smoke from fires etc.
- Interpreting Images: Natural colour representation.
- Be aware: Cloud mass may cover vast areas at once which can show as white, and obviously it doesn’t work at night…

Infrared Cloud Imagery
- Infrared imagery for cloud cover is used to identify cloud coverage and temperature.
- Interpreting Images: Cooler colours indicate higher, colder clouds.

Cloud Type Identification
- Classifies cloud types for understanding weather patterns.
- Interpreting Images: Different colours represent various cloud types.

Storm & Convection Zones
- Highlights areas of storm activity which is useful for tracking storm development.
- Interpreting Images: Intense colours indicate stronger storm activity.

Fire Heat Intensity
- Detects heat from fires to monitor fire intensity and spread.
- Interpreting Images: Warmer colours show intense heat areas.
- Be aware: Himawari 8/9 has an operational resolution of up to 500m/pixel, this means a fire usually has to be greater than 500m to be visible.

Daytime Cloud Analysis
- Detailed cloud imagery for daytime for daytime weather monitoring.
- Interpreting Images: Variations in cloud thickness and type.

Night Cloud Analysis
- Cloud monitoring during night for nighttime weather anaysis.
- Interpreting Images: Different shades indicate cloud coverage at night.

Dust
- Highlights airborne dust, dust storms and air quality.
- Interpreting Images: Dust presence shown in distinct colours.

Satellites We Use for Imaging
We combine imagery from several geostationary satellites into a seamless global composite. Each satellite is positioned to watch over its own region — from the Pacific to the Atlantic and across Europe, Africa, and Asia. By stitching their coverage together, we create a near real-time mosaic that lets you monitor weather systems, fire activity, and environmental changes across much of the world in one view.
Himawari-9
- Positioning: Located over the Western Pacific, ideal for Asia-Pacific region monitoring.
- Resolution: Captures high-resolution images, providing detailed earth observations, up to 500m.
- Frequency: Images updated every 10 minutes for near real-time environmental monitoring.
- Operator: Operated by the Japan Meteorological Agency, contributing to global weather surveillance and natural disaster tracking.
- Mission: Essential for tracking weather systems, aiding in forecasting and disaster response.
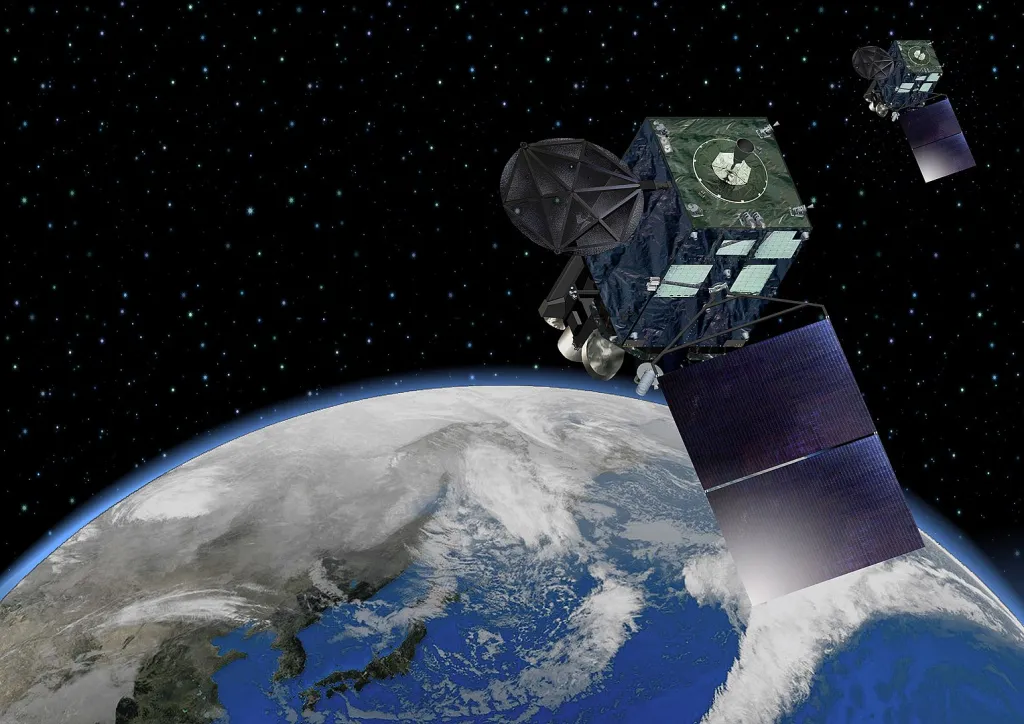 Japan Meteorological Agency Rendering of Himawari 8/9 (CC-BY-SA)
Goes-West
- Positioning: Providing coverage of the western United States, eastern Pacific Ocean, and parts of Australasia.
- Resolution: Captures high-resolution imagery, including up to 500m for visible bands, supporting detailed views of oceanic and atmospheric conditions.
- Frequency: Updates imagery every 10 minutes, with mesoscale sectors enabling 1-minute scans for fast-evolving events like wildfires and cyclones.
- Operator: Managed by NOAA under the GOES-R satellite program, working in tandem with GOES-East for full hemispheric coverage.
- Mission: Vital for tracking Pacific weather systems, volcanic activity, marine hazards, and supporting emergency response efforts on the western rim of the Americas.
Goes-East
- Positioning: Placed to monitor the eastern United States, Atlantic Ocean, and much of South America.
- Resolution: Provides high-resolution imagery, including 500m resolution for visible bands, enabling detailed monitoring of cloud patterns, storms, and land features.
- Frequency: Delivers imagery every 10 minutes, with rapid scan modes offering 1-minute updates for high-impact weather events (not used currently).
- Operator: Operated by the National Oceanic and Atmospheric Administration (NOAA) of the United States as part of the GOES-R series.
- Mission: Supports weather forecasting, severe storm tracking, fire detection, and environmental monitoring across the Americas and Atlantic basin.
Eumetsat Meteosat-12 (MTG-I1)
Positioning: Located over the prime meridian (0° longitude), providing continuous coverage of Europe, Africa, and the Atlantic Ocean.
Resolution: Advanced Flexible Combined Imager (FCI) delivers imagery at resolutions as fine as 500m in visible bands, enabling detailed Earth observation.
Frequency: Standard full-disk imagery every 10 minutes, with rapid-scan modes capable of 2.5-minute updates for fast-evolving events. Due to licencing limitations (reach out if you’d like to help fund this!), we typically have hourly access.
Operator: Operated by EUMETSAT as part of the Meteosat Third Generation (MTG) programme.
Mission: Designed to improve severe weather monitoring, wildfire detection, air quality tracking, and climate applications across Europe, Africa, and surrounding regions.
How do we do this?
Unlike static imagery, live satellite feeds aren’t “map ready.” Every 10 minutes, satellites like Himawari-9 or GOES transmit raw data in specialised scientific formats. To turn that into something you can interact with on Bushfire.io, we’ve built a high-performance processing pipeline from scratch.
Here’s what happens, every 10 minutes:
Ingest raw data – We capture downlinked satellite files as soon as they’re broadcast.
Assemble snapshots – Each dataset is stitched into a full “frame” (e.g., the 00:10 UTC Himawari capture).
Process into products – From that frame, we generate True Colour, Infrared, Cloud Type, Storm, Fire Heat, Dust, and other composites.
Georectify & clean – Images are aligned to Earth’s surface and artefacts from sunlight, edges, or missing data are corrected.
Merge coverage – Outputs from multiple satellites are blended into a single, seamless global composite.
Optimise for delivery – The giant full-disk images are resized for different zoom levels, tiled into high-performance map formats, and served worldwide via our infrastructure.
Traditional approaches often take tens of minutes to hours per file. Our system achieves this in 1–2 minutes, at global scale, continuously. That means you can pan and zoom around near real-time imagery — something that’s simply not possible with static charts or slower systems.
By contrast, the Bureau of Meteorology (BOM) publishes Himawari-9 imagery at 1–2 km resolution (Infrared, Visible, Zehr, and True Colour/Infrared composites) delivered mainly as static JPGs or downloadable GeoTIFF/NetCDF files. These are excellent for broad weather monitoring, but Bushfire.io goes further: processing imagery at 500 m resolution, blending multiple satellites into a global composite, and offering a much wider range of layers — all streamed interactively in-app or via APIs.
Enterprise Access
For enterprises, we also provide direct access to satellite imagery in the format that best fits your workflows:
Raw datasets (original)
Processed composites per satellite (GeoTIFF)
Global composites (GeoTIFF or PMTiles2)
XYZ tile feeds for apps and GIS platforms, delivered via Tiley, our in-house high-performance map tile server
👉 If you need live satellite data in your workflows, from fire intelligence to aviation or insurance, we can integrate directly.