GIS Services
Everything on our map, inside ArcGIS and QGIS
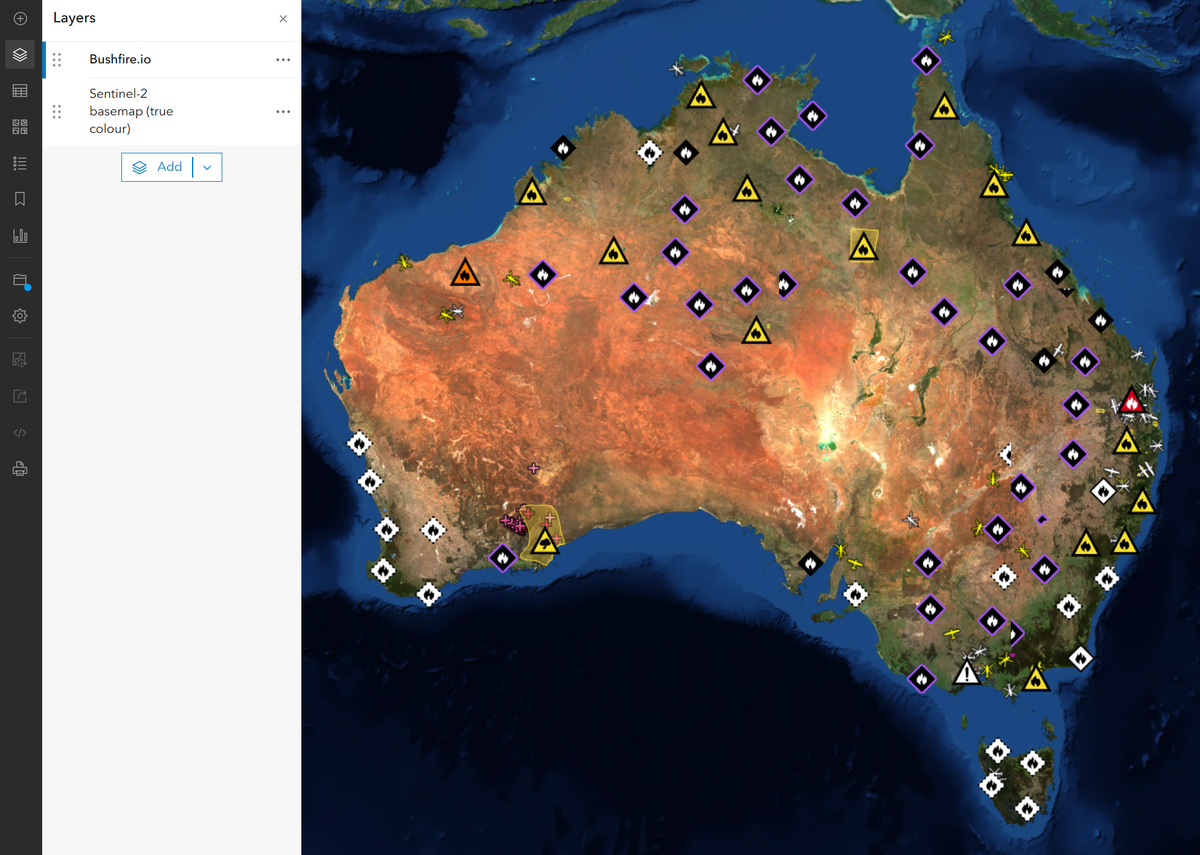
Live warnings, incidents, hotspots, Possible Fire Ignitions and global near real-time satellite as standard WMTS, WMS and XYZ services, alongside our S2 basemap and 3D terrain. Connect in minutes with keys you create and revoke yourself.
Why GIS teams use it
One connection instead of a dozen feeds
Standard OGC services
One layer or every layer
Self-service keys
Layers
What’s in the catalogue
Each layer has one name across WMTS, WMS and XYZ, shown under its title. WFS adds the feature data for analysis.
| Layer | What it shows | Updates | Services |
|---|---|---|---|
| Bushfire.io (combined)bushfireio | Our live layers in one styled layer, as on our map | Continuous | WMTS, WMS |
| Warnings and incidentsall_warnings_incidents | Every warning and incident in one layer, styled as on our map | As agencies publish | WMTS, WMS, XYZ, WFS |
| Warningsall_warnings, all_warnings_advice, all_warnings_watchandact, all_warnings_emergency | Official fire and emergency warnings, together or one alert level at a time | As agencies publish | WMTS, WMS, XYZ, WFS |
| Incidentsall_incidents, incidents_fire_uncontrolled, incidents_fire_controlled, incidents_fire_burn | Uncontrolled and controlled fires and planned burns, together or by status | As agencies publish | WMTS, WMS, XYZ, WFS |
| Possible Fire Ignitionsignitions | Likely new fires our detection flags, often before an official report | Continuous | WMTS, WMS, XYZ, WFS |
| Hotspots and satellite detected fireshotspots, satellite_detected_fires | Heat detections from polar-orbiting and geostationary satellites | As satellites pass | WMTS, WMS, XYZ, WFS |
| Road closures and hazardsroad_closures, road_hazards | Closed and hazardous roads from state road agencies | As agencies publish | WMTS, WMS, XYZ, WFS |
| Fire danger ratingsfiredanger | Today's fire danger rating by district | Daily | WMTS, WMS, XYZ, WFS |
| Near real-time satellitesatellite_true_colour, satellite_ir_clouds, satellite_fire_temperature, satellite_convection, satellite_cloud_phase, satellite_day_microphysics, satellite_night_microphysics, satellite_dust | Global true colour, IR clouds, fire temperature, convection, dust and more from geostationary satellites | About every 10 minutes | WMTS, WMS, XYZ |
| S2 basemapsentinel2_basemap, sentinel2_falsecolor, sentinel2_ndvi | Cloudless 10 m quarterly mosaic in true colour, colour infrared and NDVI | Quarterly | WMTS, WMS, XYZ |
| 3D terrainterrain | Elevation as Terrarium tiles: 5 m LiDAR across much of Australia, 30 m worldwide | Static | XYZ |
| Feature data for analysisincidents, incidents_polygons, roads, roads_lines, firedanger_polygons, weather | Warnings, incidents, burn areas, road impacts, fire danger districts and weather observations with every attribute | As agencies publish | WFS |
Coverage of live layers: Australia, the United States, Canada and Europe. Near real-time satellite and the S2 basemap are global. Some layers need a particular plan or add-on.
Connect
Paste one URL
YOUR_KEY with an access key, add the connection, and drag layers onto your map.- ArcGIS Pro: Insert, Connections, New WMTS Server
- ArcGIS Online: Add layer from URL
- QGIS: Browser, WMS/WMTS, New Connection
- ArcGIS Online XYZ: write
{z}/{x}/{y}as{level}/{col}/{row}
https://tiley.bushfire.io/v1/ogc/wmts?SERVICE=WMTS&REQUEST=GetCapabilities&token=YOUR_KEYhttps://tiley.bushfire.io/v1/ogc/wms?SERVICE=WMS&REQUEST=GetCapabilities&token=YOUR_KEYhttps://tiley.bushfire.io/v1/ogc/wfs?SERVICE=WFS&REQUEST=GetCapabilities&token=YOUR_KEYhttps://tiley.bushfire.io/v1/raster/all_warnings_incidents/{z}/{x}/{y}.png?token=YOUR_KEYhttps://tiley.bushfire.io/v1/tiles/sentinel2/{level}/{col}/{row}?token=YOUR_KEYBasemap included
Live layers over a current 10 m basemap
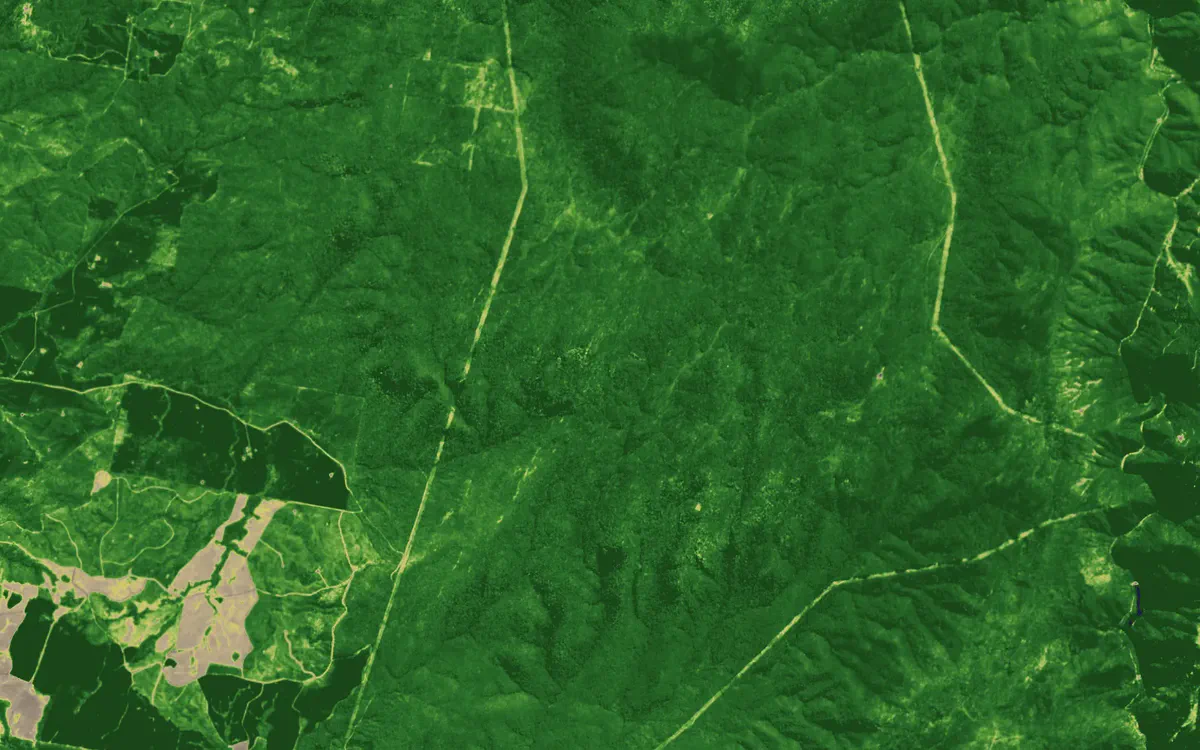
Transmission easements near Talbingo, NSW, in NDVI. Contains modified Copernicus Sentinel data 2026.
Specifications
The details your GIS team will ask for
| Services | WMTS 1.0.0, WMS 1.3.0, XYZ tiles. WFS 2.0 with the Data and API Access add-on. |
|---|---|
| Projection | Web Mercator (EPSG:3857) tiles |
| XYZ | Any layer by name at /v1/raster/{layers}/{z}/{x}/{y}.png, several stacked with commas, @2x for 512 px |
| Authentication | Access key as a token query parameter, or as the password in QGIS authentication |
| Live layers | Warnings, incidents and burn areas, Possible Fire Ignitions, hotspots, roads and fire danger ratings |
| Near real-time satellite | Global geostationary mosaic, about every 10 minutes, roughly 500 m per pixelTrue colour, IR clouds, fire temperature, convection, cloud phase, day and night microphysics, dust |
| Basemap | S2 basemap: cloudless 10 m quarterly mosaic in true colour, colour infrared and NDVI |
| Terrain | Terrarium-encoded elevation tiles: 5 m LiDAR across much of Australia, 30 m worldwide |
| Key management | Create, scope, expire and revoke keys from your account. Keys never outlive your licence. |
| Plan | Included with Bushfire.io Enterprise. WFS needs the Data and API Access add-on. |
Questions, answered
Do I need Enterprise?
How current are the layers?
Can we put these layers on a public website?
Can we get the raw data?
Add live hazards to your GIS this week
Tell us which tools you run and which areas matter. We’ll get your team connected.