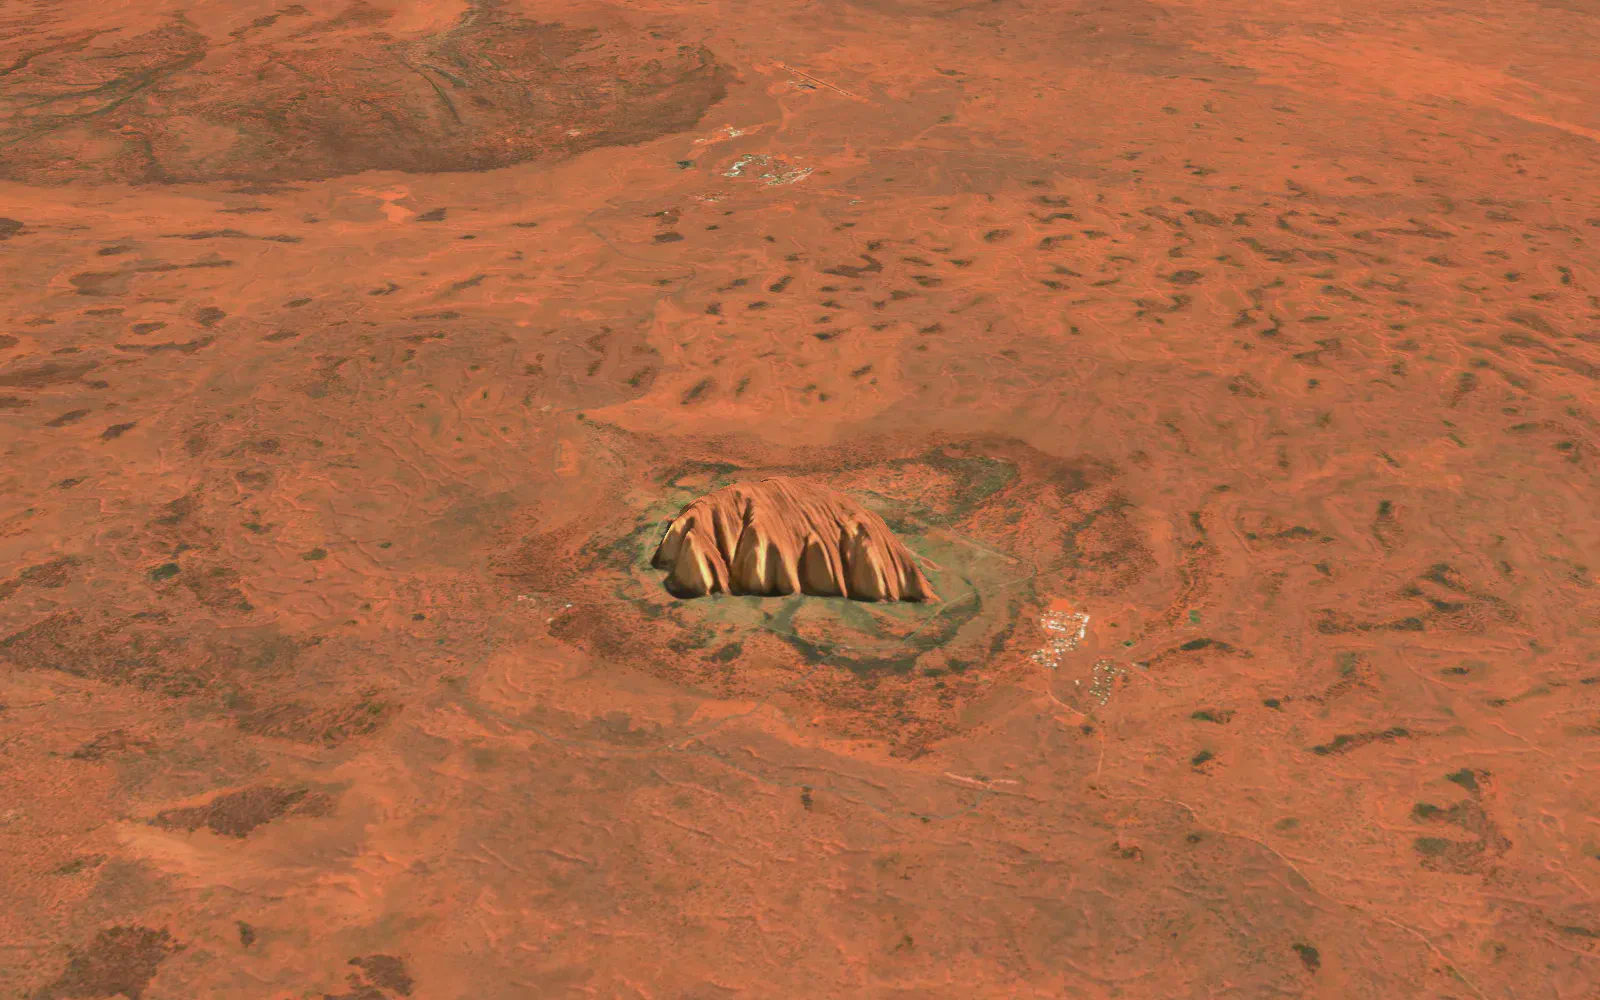
S2 Basemap · 2026 Q2
A current 10 m view, every quarter
A cloudless quarterly mosaic from Copernicus Sentinel-2, in true colour, colour infrared and NDVI from one surface-reflectance archive, over 3D terrain. On the same key as our live hazard layers, and ready for public apps.
Drag the map, or switch views below. Open the full explorer.
Uluru. Contains modified Copernicus Sentinel data 2026. Terrain: Mapterhorn, Geoscience Australia (CC BY 4.0), Copernicus GLO-30.
Why it's different
Recent, consistent, and made for reading the land
Recent
Consistent
Three views, one key
Use it in public
See the difference
Vegetation you can actually read
NDVI and colour infrared turn subtle colour differences into clear signals: irrigated paddocks, harvested compartments, regrowth and stressed vegetation. Drag to compare.
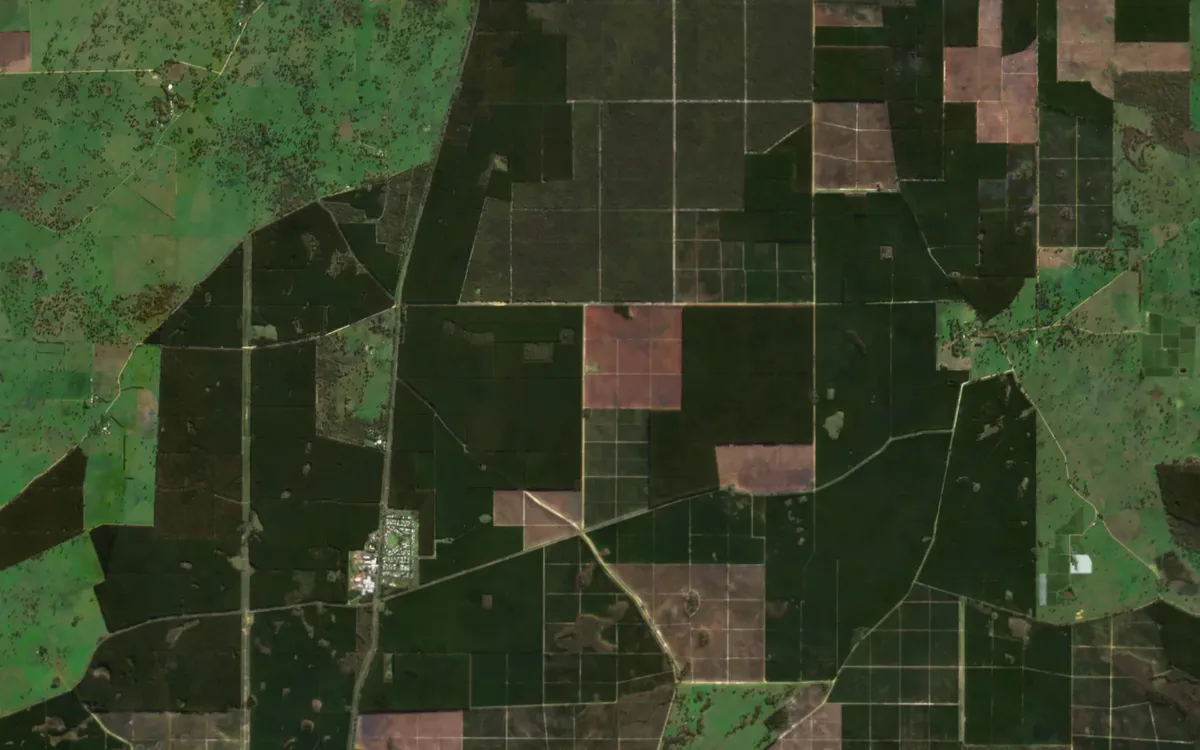
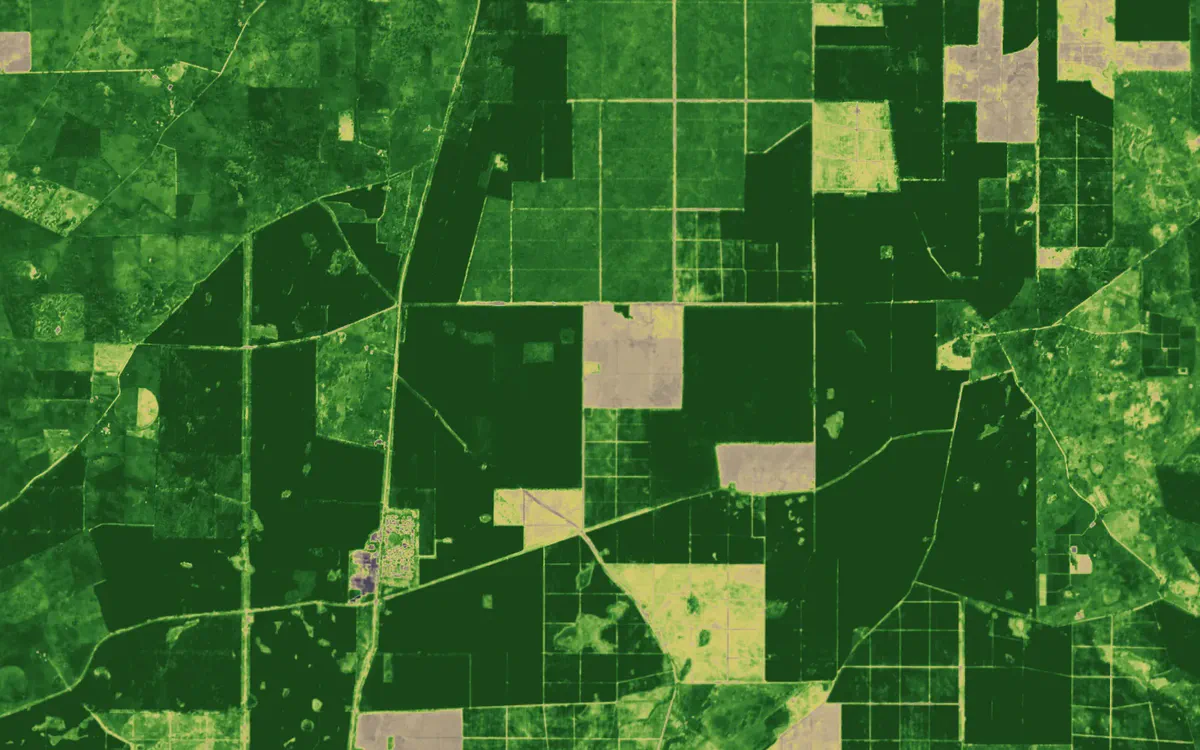
Pine plantations near Nangwarry, South Australia, 2026 Q2. Contains modified Copernicus Sentinel data 2026.
Use cases
Built for the work you do on the ground
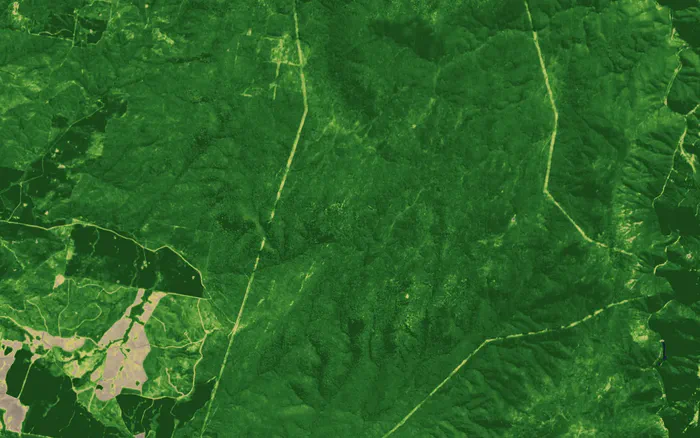
NDVI
Easements and corridors
Track regrowth under lines and along pipelines every quarter.
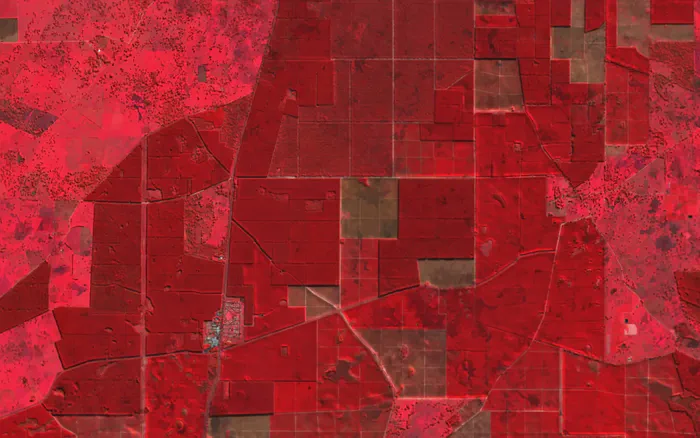
Colour infrared
Plantations and forestry
See harvested, replanted and maturing compartments at a glance.
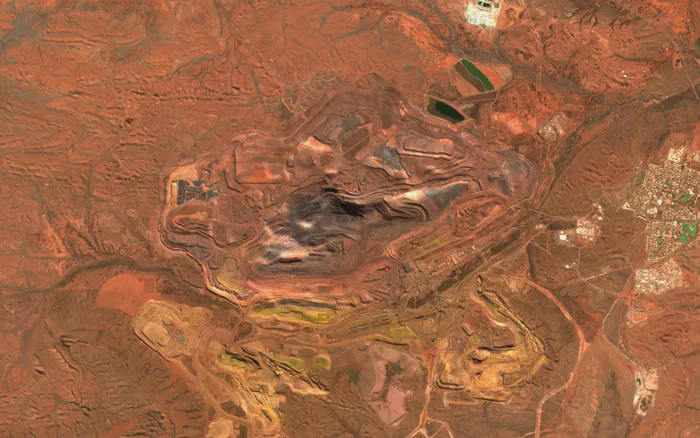
True colour
Mine sites
Pits, dumps, haul roads and rehabilitation, refreshed each quarter.
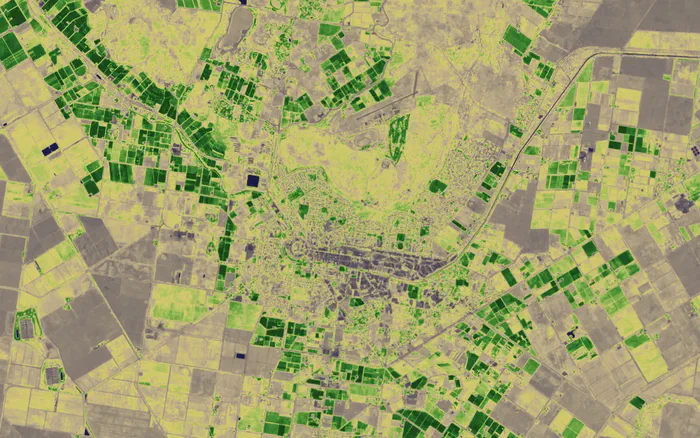
NDVI
Paddocks and irrigation
Paddock-scale vegetation condition across whole regions.
3D terrain
Ranges, gorges and craters, in 3D
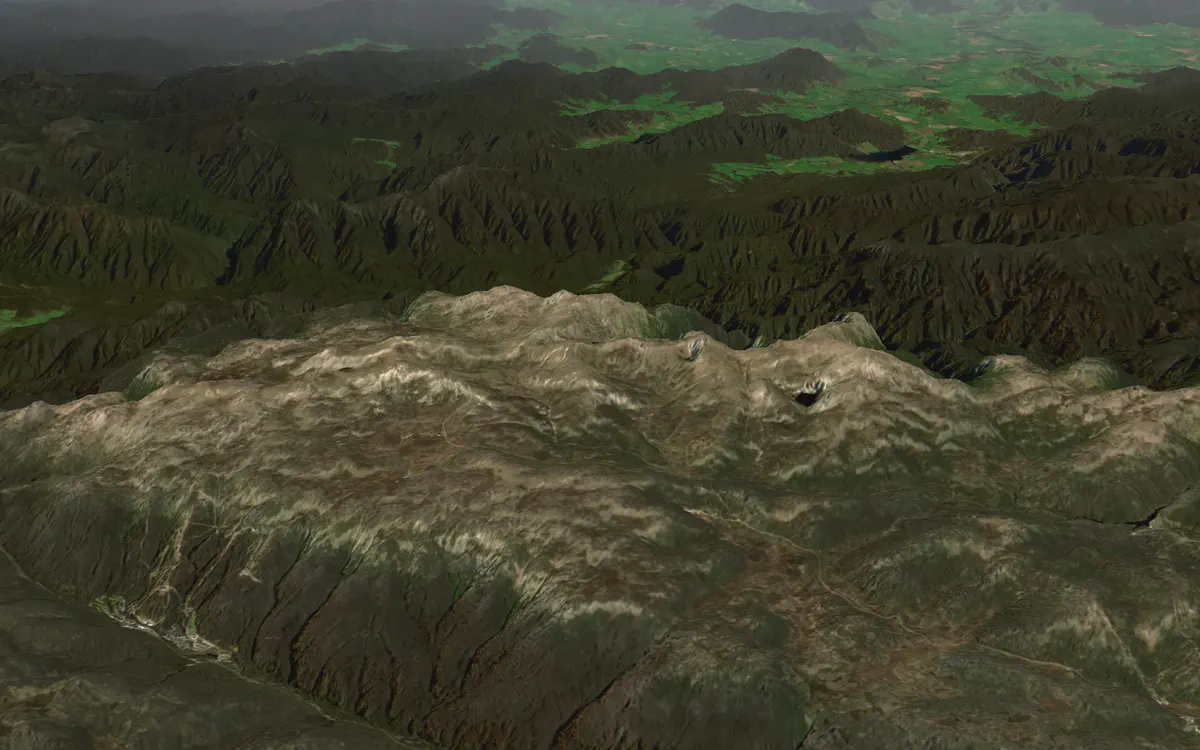
Main Range, Kosciuszko National Park, NSW. Contains modified Copernicus Sentinel data 2026.
Specifications
The details
| Source | Copernicus Sentinel-2 quarterly mosaics |
|---|---|
| Resolution | 10 m |
| Refresh | Every quarter. The current mosaic is 2026 Q2.Gaps in a quarter are filled from the previous one. |
| Views | True colour, colour infrared and NDVI, rendered from four-band (red, green, blue, near-infrared) surface reflectance |
| Delivery | XYZ raster tiles (512 px, Web Mercator, native to zoom 13), also listed in WMTS and WMS |
| Terrain | Terrarium-encoded elevation tiles to zoom 15: 5 m LiDAR across much of Australia, 30 m worldwide |
| Use | Your apps, websites and GIS, including public display with attribution |
| Archives | Four-band surface reflectance for your region each quarter, as raw data or map tiles, on request |
| Plan | Included with Bushfire.io Enterprise. Infrared and NDVI views are also in the Bushfire.io app from Pro. |
How it compares
Where it fits among satellite basemaps
| S2 Basemap | Annual cloudless mosaics | Global imagery basemaps | |
|---|---|---|---|
| Imagery | |||
| How recent | This quarter | Up to a year old | Mixed, often years old |
| Consistency between regions | One sensor and season | One sensor and year | Patchwork of sources and dates |
| Resolution | 10 m | 10 m | Often sub-metre in cities |
| Views and data | |||
| True colour | |||
| Colour infrared and NDVI | – | – | |
| Surface reflectance archives | On request | Varies | – |
| 3D terrain on the same key | – | Varies | |
| Live hazard layers on the same key | – | – | |
Aerial and sub-metre imagery is the better choice for detail in towns and cities. The S2 basemap is built for recency and for reading vegetation across large areas.
Developers
Drop it into any map
YOUR_KEY, and add the credits.https://tiley.bushfire.io/v1/tiles/sentinel2/{z}/{x}/{y}?token=YOUR_KEY
https://tiley.bushfire.io/v1/tiles/sentinel2-falsecolor/{z}/{x}/{y}?token=YOUR_KEY
https://tiley.bushfire.io/v1/tiles/sentinel2-ndvi/{z}/{x}/{y}?token=YOUR_KEYmap.addSource("s2", {
type: "raster",
tiles: ["https://tiley.bushfire.io/v1/tiles/sentinel2/{z}/{x}/{y}?token=YOUR_KEY"],
tileSize: 512,
maxzoom: 13,
attribution: "© Disaster Science. Contains modified Copernicus Sentinel data 2026",
});
map.addLayer({ id: "s2", type: "raster", source: "s2" });L.tileLayer("https://tiley.bushfire.io/v1/tiles/sentinel2/{z}/{x}/{y}?token=YOUR_KEY", {
tileSize: 512,
zoomOffset: -1,
maxNativeZoom: 13,
attribution: "© Disaster Science. Contains modified Copernicus Sentinel data 2026",
}).addTo(map);https://tiley.bushfire.io/v1/ogc/wmts?SERVICE=WMTS&REQUEST=GetCapabilities&token=YOUR_KEYAttribution
Credits to show with the basemap
You can show the S2 basemap in your own apps, on public websites and in public apps. Wherever it appears, include these credits.
© Disaster Science
Contains modified Copernicus Sentinel data 2026
Terrain: Mapterhorn, Geoscience Australia (CC BY 4.0), Copernicus GLO-30
Questions, answered
Why 10 m and not 50 cm?
How do I buy it?
Can I use it in a public app or website?
Can I get the underlying data?
Can I see it before I buy?
Put a current basemap under your work
Buy Enterprise online today, or talk to us about the basemap on its own, archives and custom regions.